The view functionality
To check all the options run
soundfactory view --help
Usage: soundfactory view [OPTIONS]

Options:
  -i, --input-file INPUT        [required]
  -e, --calculate_envelope      Whether to show the signal envelope
  -w, --msec-window MSECWINDOW  Time window for sliding FFT in Specgram Plot
  --start FLOAT                 seconds to start from
  --end FLOAT                   seconds to end to
  --min-freq FLOAT              min frequency to show
  --max-freq FLOAT              max frequency to show
  --single
  --separate
  --thr FLOAT                   amplitude percentage threshold
  --log-pws
  --save-fig
  --help                        Show this message and exit.
Use the -w option to increase (or decrease) the sliding window for the spectrogram if spectral lines are not resolved in the plot.
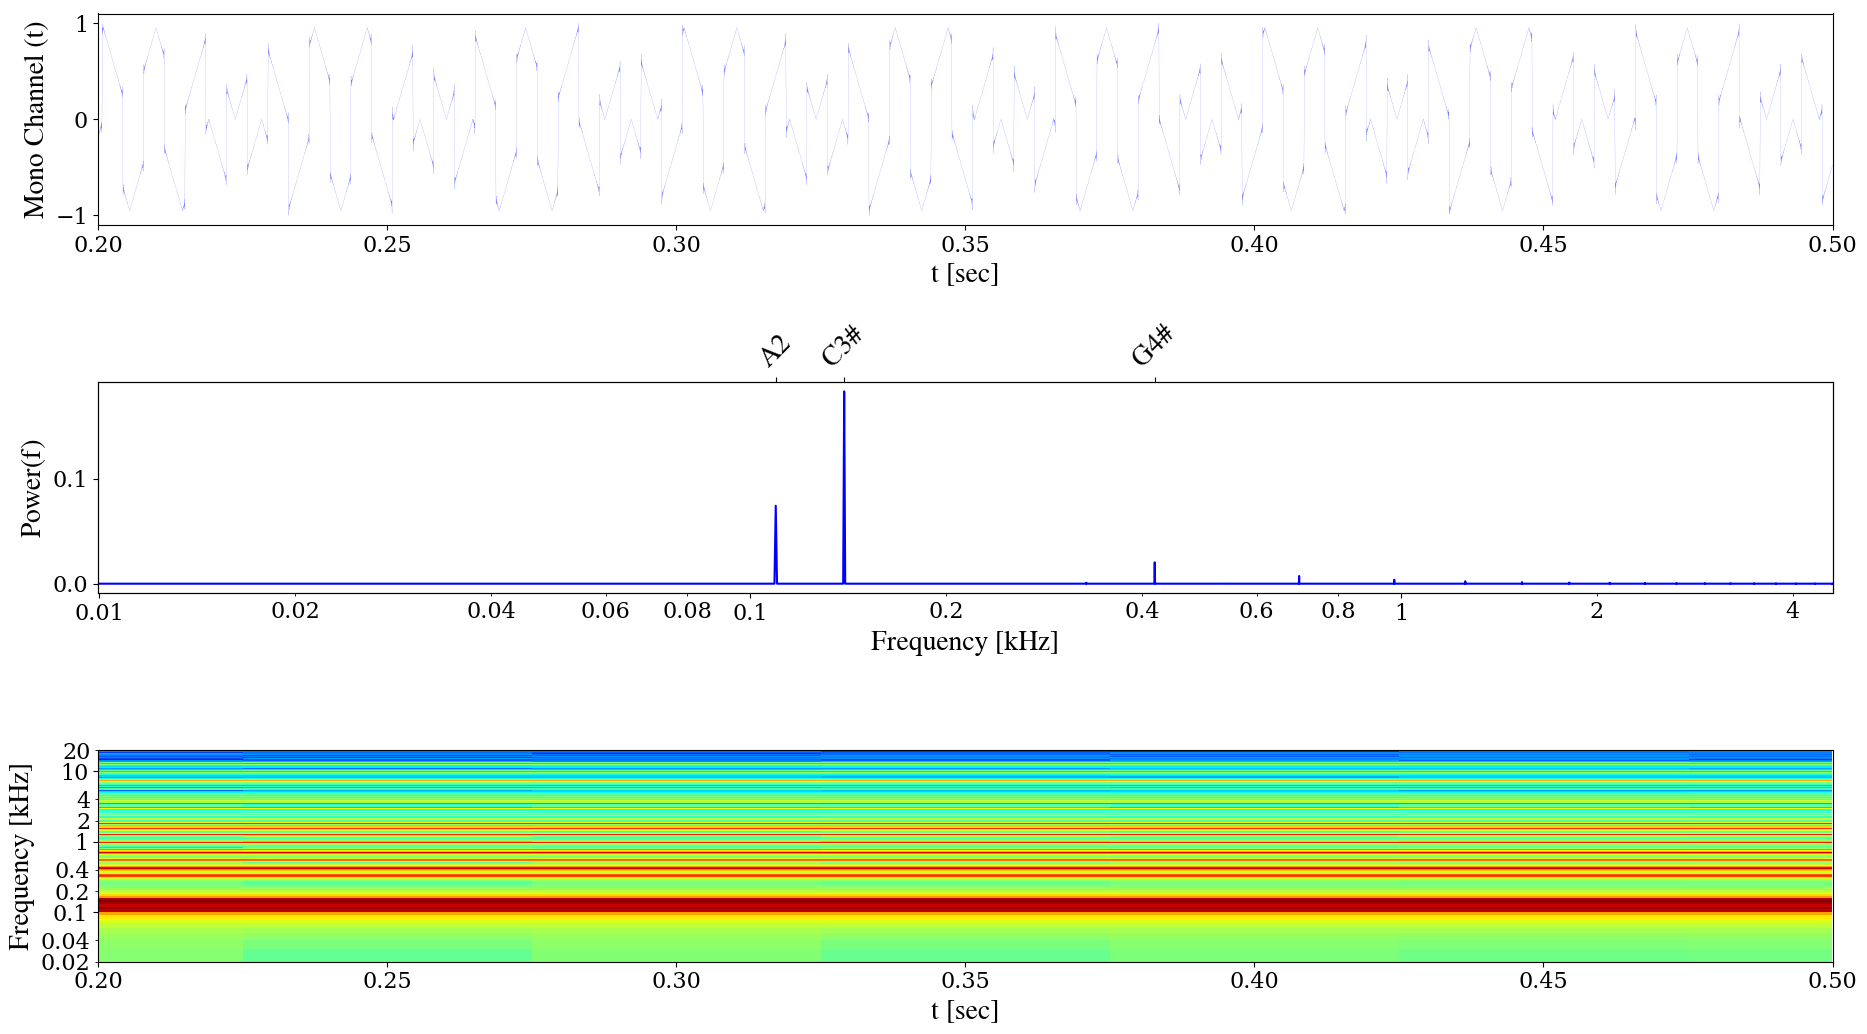
To inspect 300 milliseconds of the beat_20_1.wav sample produced in the
create example run
soundfactory view --start 0.2 --end 0.5 -i beat_20_1.wav
You should get the following image:
You can save on disk all the single plots separately by running
soundfactory view --start 0.2 --end 0.5 -i beat_20_1.wav --separate --save-fig
which will create the beat_20_1_signal_0.png, beat_20_1_fft_0.png,
and view_spectrogram_0.png in the current directory.